Chelsea FC Transfer Fee Analysis (Power BI)
- Brandon Hopkins
- Sep 1, 2022
- 2 min read

Updated: Jan 20, 2023
Background and Purpose
If you've gotten a chance to explore my website and take a look at the Interests page, you'll see that I'm a huge fan of Chelsea FC, a football/soccer club in London. I've been obsessed with following every game since 2006! I've seen the team's highest moments, including winning the Champions League twice, as well as some of the lows (John Terry slipping in the rain while taking a crucial penalty kick in the Champions League final against Manchester United - they ended up losing).
A big indicator in whether the team is successful or not for any given season is the incoming and outgoing players, and the transfer fee (money either received from selling a player or spent on an incoming player) associated with them. The purpose of this project was to take a closer look at their transfer record and see if I could notice any trends relating transfer data and season outcome.
Data Collection
All data used for the project was pulled from an online transfer database (https://www.transfermarkt.us/), the website is really cool because you can search and filter transfer data based on league, team, season, etc. To do this project, I imported the data that I wanted to analyze from the web into Power BI.
Data Visualization
Once the data was in Power BI, I used Power Query to clean and reformat the data to my liking. The raw data was pretty good, but I wanted to reformat some of the player names, positions, etc. so that everything was a little more readable. I also removed any players that joined the club via the youth team - often times these players did not have any involvement in the season but were called up to round out the roster and they also skewed the results since calling up a player from the youth system does not cost money. Finally, I wanted to see some of the data aggregated (transfer totals, average ages, etc.) so I wrote a few basic DAX expressions to create measures that better summarized the season.
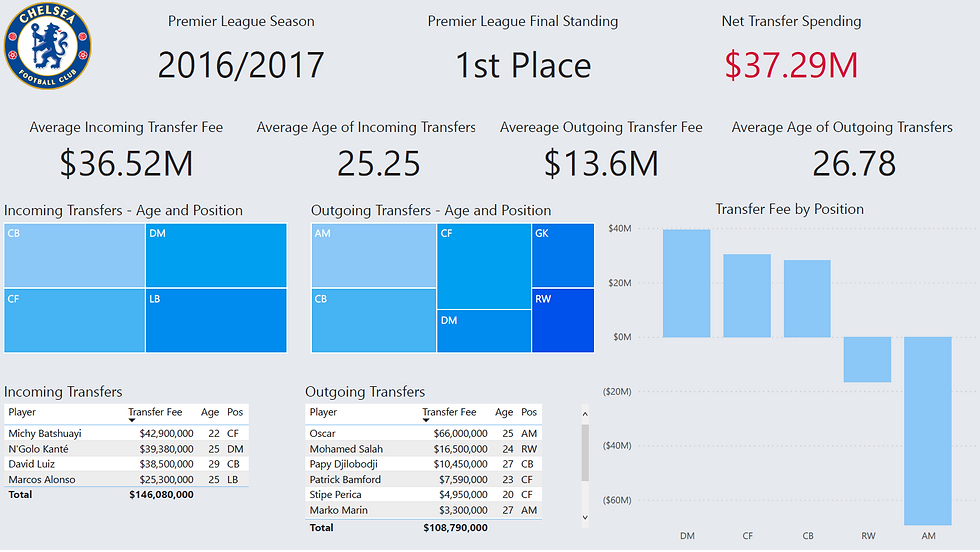
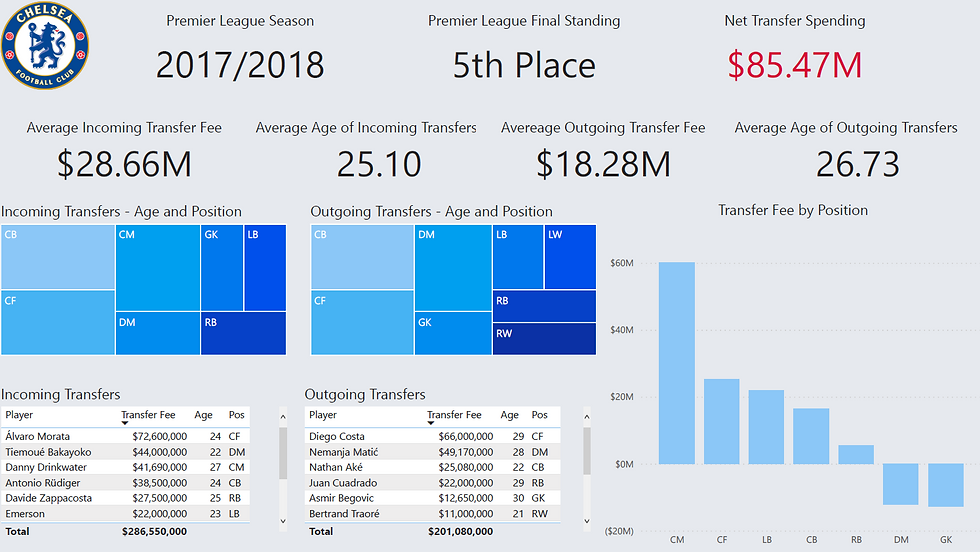
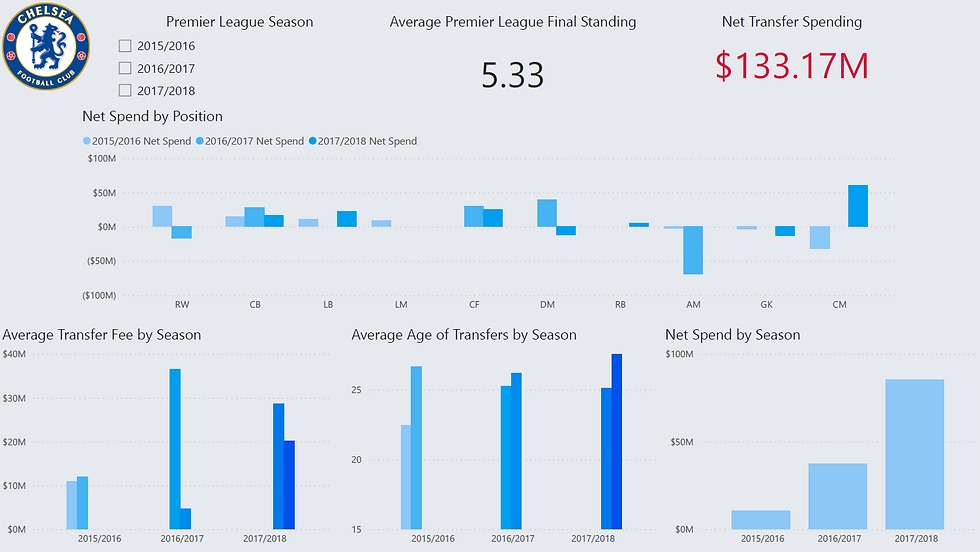
I created a series of reports, each page dedicated to a specific season. These reports were then summarized in a final dashboard. Each reports, as well as the dashboard, included the final standing, net transfer spending, and summaries of incoming and outgoing positions, ages, and transfer fees.

Key Insight
There are countless factors that impact Premier League performance over the course of a season, however the takeaway from this limited study is that the team performed better in the league in years that both the net spend and average age of incoming transfers were higher. This makes sense, as a more expensive and/or older player typically has more ability (hence the higher fee) or brings more experience to the team.
Lessons Learned and Future Activity
With each project I find that there is a lesson learned along the way. I definitely plan to continue this project and add data from more seasons. It is hard to take away meaningful insight from this type of study without a larger sample size of data. I wanted to start with three seasons, but my original goal was to eventually work my way up to the current season. By doing this, I think this would give me a more well-rounded project. Stay tuned for updates!


Comments